


Message dashboard: Mastering conversation insights
Learn to track and analyse key metrics such as conversion rates, response times, broadcast reports, team performance, and more with Pepper Cloud's message dashboard.
Communication has been a cornerstone for successful sales and customer service. But with so many interactions happening across multiple channels, it can be challenging to stay on top of everything and measure your team's performance accurately.
That's where the Pepper Cloud Message Dashboard comes in. This powerful tool provides a comprehensive overview of your communication activity, offering valuable insights that can help you optimise your strategies and achieve your goals.
Different types of reports in the message dashboard
The Message Dashboard offers various reports focusing on different aspects of your communication performance. Let’s understand each report:
- Conversation Overview
- Response and Resolution Time Reports
- Leadership Reports
- Broadcast Reports
1. Conversation Overview
The Conversation overview report provides a comprehensive snapshot of your team’s communication activity and equips you with key metrics data.
- Total Open Conversations: It is the total number of active or open conversations your team is currently handling.
- Total Closed Conversations: It is the total number of conversations that have been closed. If you choose to see this metric for any specific user, you can access it through the leaderboard.
- Total Conversations Converted to Leads: It is the total number of conversations that have been successfully converted into Leads from the message module. This helps you analyse how effectively your communication efforts are generating potential customers.
- Total Conversations Converted to Contacts: It is the total number of conversations that have been successfully converted into Contacts from the message module.
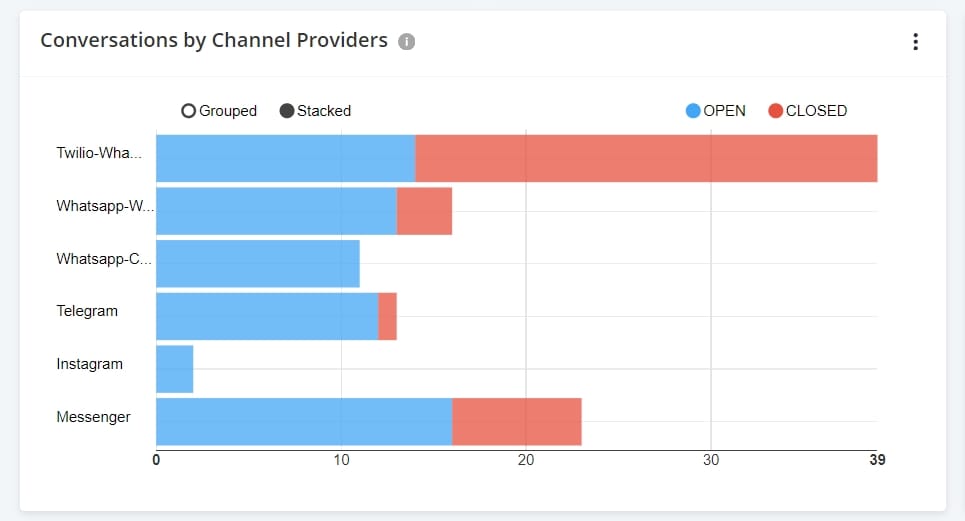
- Conversations by Channel Providers: It gives the details of total conversations categorised by channel providers such as WhatsApp, Facebook Messenger, Instagram, etc. This helps you identify the channels that are driving the most engagement.
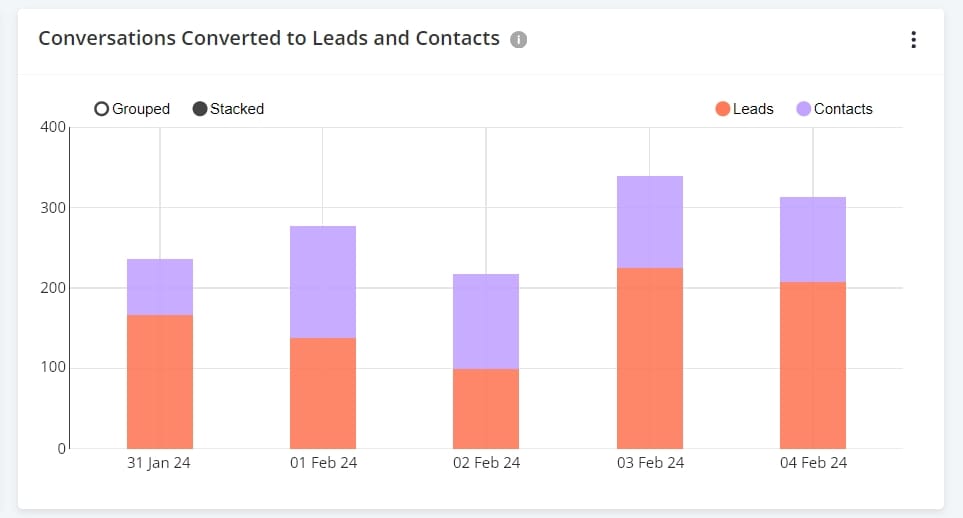
- Conversations Converted to Leads or Contacts: It is the number of conversations that were successfully converted into Leads or Contacts from the Message Module within the given time. It helps you to evaluate the effectiveness of your communication in turning conversations into valuable leads or contacts.
The report has a filter specific to this section. With this filter, you can choose to see conversion rates of conversation to only leads, conversion rates of conversation to only contacts, or conversion rates of conversation to leads and contacts.
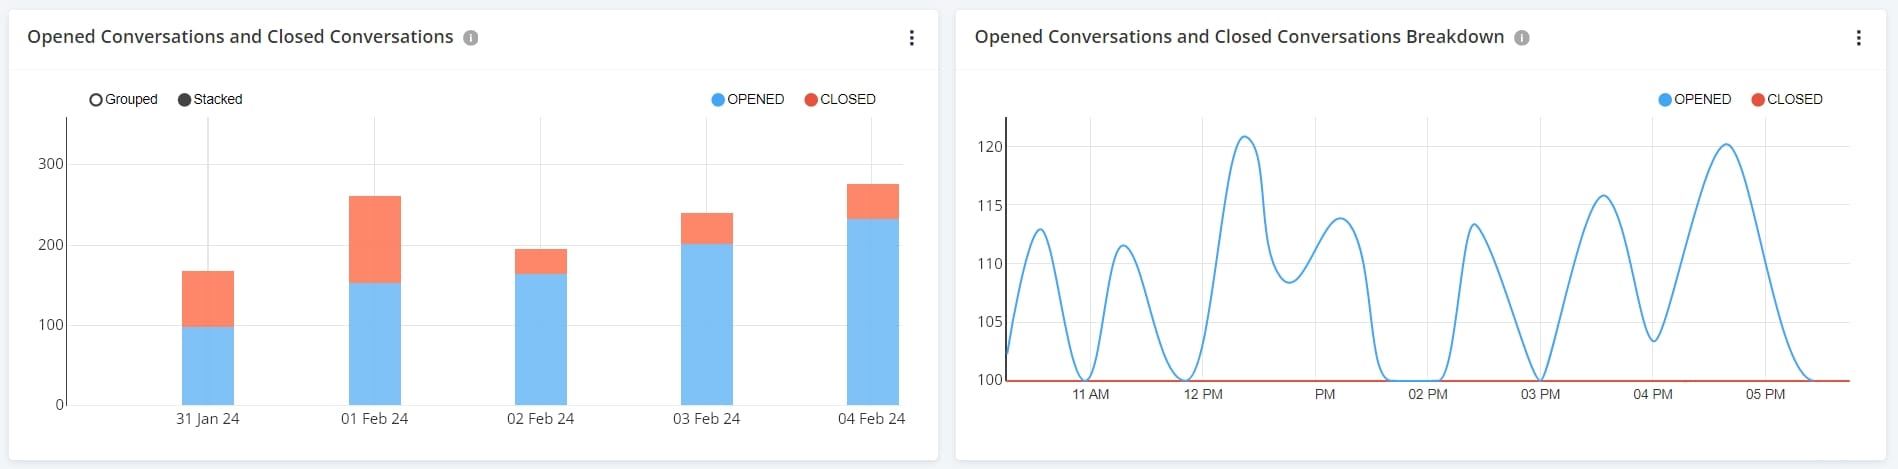
- Opened Conversations and Closed Conversations: It is the total number of conversations by open and closed statuses within a given period. It helps you to gain insights into the percentage of conversations that are successfully closed and identify areas for improvement. The report has a filter specific to this section. With this filter, you can choose to see conversations with only open rates, conversations with only close rates, or conversations with open-close rates.
- Opened Conversations and Closed Conversations Breakdown: It is the breakdown of conversations with “open” and “close” statuses within the given time. This assists you in analysing open-close rates by channel, user, or date range to pinpoint specific areas of focus.
2. Response and Resolution Reports
Response and resolution reports provide invaluable insights into the efficiency and effectiveness of your team's response and resolution times, empowering you to identify bottlenecks and optimise your workflow for greater efficiency.
- Average Resolution Time: It is defined as the average duration between the opening and closing of conversations. The report considers only the conversations that are closed. It helps you to track the average time it takes to resolve a conversation, highlighting areas where efficiency can be improved.
- Average First Assignment to Close Time: It is defined as the average time it takes to resolve a conversation after it has been first assigned to a team member. Please note that if a conversation is closed and reopened, then it will be counted as a new conversation.
- Average First Response Time: It is defined as the average time it takes for your team to respond to a new conversation for the first time from the time the conversation has been opened. This report provides you with insights on timely engagement.
- Average Open Time to First Assignment: It is the average duration between opening the conversations and assigning the conversations. It helps you to identify any delays in assigning conversations to team members and address potential bottlenecks.
- Resolution Time Breakdown: This table provides a detailed breakdown of conversations closed within the selected period, categorised by their resolution time. This table provides 3 columns:
- Resolution time: The resolution time is categorised into groups such as < 5 minutes, 5 - 15 minutes, 15 - 30 minutes, 30 minutes - 1 hour, 1 hour - 3 hours, 3 hours to 8 hours, > 8 hours
- Count: Total number of conversations within the time range.
- % Conversation: The percentage of conversations that happened within the time range.
- First Response Time Breakdown: It is defined as the breakdown of closed conversations based on their first response times. This table will have 3 columns.
- First Response Time: The first response time is categorised into groups such as < 5 minutes, 5 - 15 minutes, 15 - 30 minutes, 30 minutes - 1 hour, 1 hour - 3 hours, 3 hours to 8 hours, > 8 hours
- Count: Total number of conversations within the time range.
- % Conversation: The percentage of conversations that received the first responses within the time range.
- First Assignment to Close Time Breakdown: It is defined as the breakdown of closed conversations based on the first assignment to close time. This helps in analysing the time taken to resolve conversations after the assignment to identify areas for improvement. This table has 3 columns:
- First Assignment to Close Time: The first assignment to close time is categorised into groups such as < 5 minutes, 5 - 15 minutes, 15 - 30 minutes, 30 minutes - 1 hour, 1 hour - 3 hours, 3 hours to 8 hours, > 8 hours
- Count: Total number of conversations within the time range.
- % Conversation: The percentage of conversations that were closed (from the first assignment time) within the time range.
- Open to First Assignment Time Breakdown: It is defined as the breakdown of closed conversations based on the open time to first assignment. It helps in identifying potential delays in assigning new conversations and streamlining your workflow. The table has 3 columns:
- Open time to first assignment: The open time to first assignment is categorised into groups such as < 5 minutes, 5 - 15 minutes, 15 - 30 minutes, 30 minutes - 1 hour, 1 hour - 3 hours, 3 hours to 8 hours, > 8 hours
- Count: Total number of conversations within the time range.
- % Conversation: The percentage of conversations that were opened and assigned within the time range.
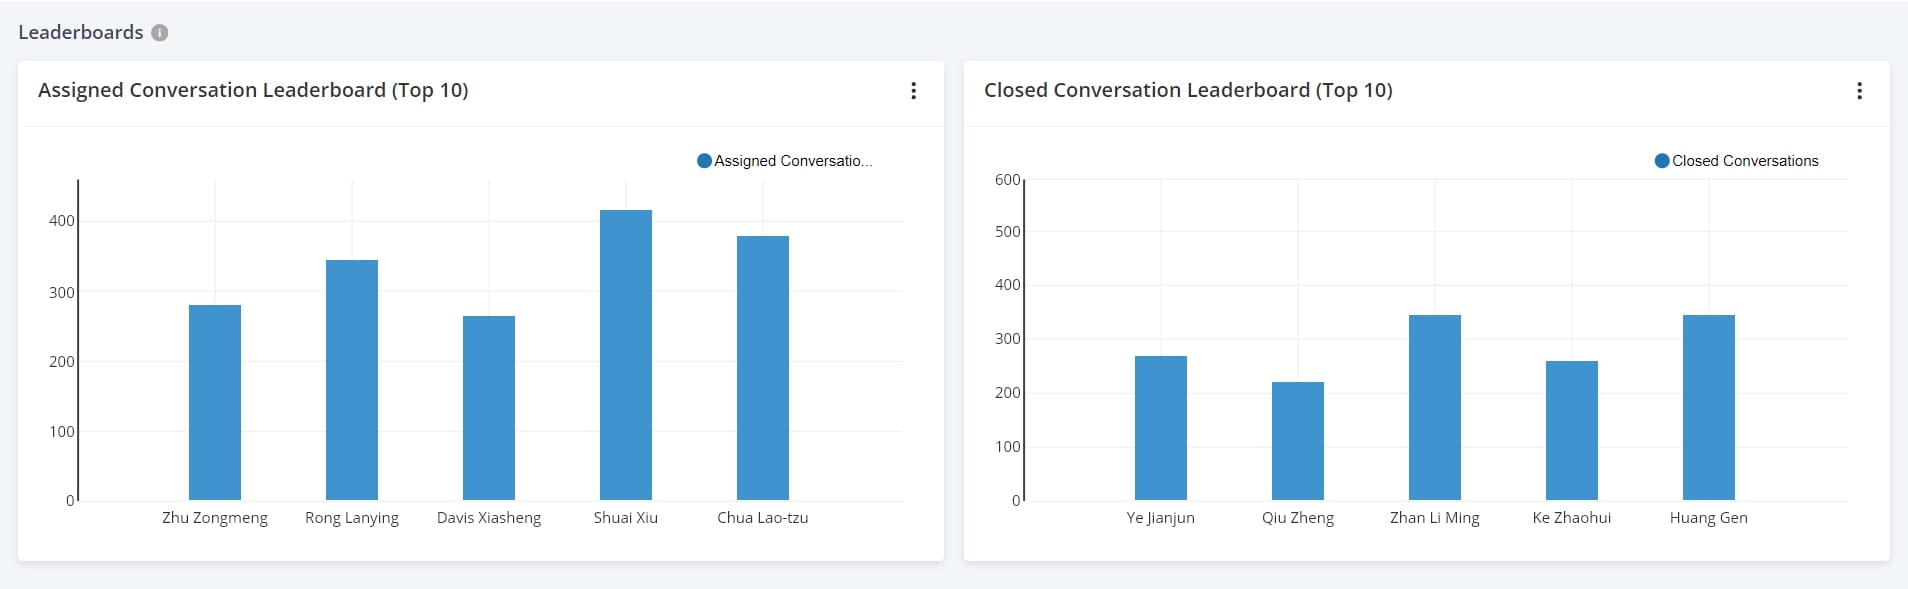
3. Leadership report
Leadership reports provide a visual representation of how the individuals and team are performing compared to each other, offering an opportunity to recognise the achievements of your team.
- Assigned Conversation Leaderboard (Top 10): It is a leaderboard of your teammates with the highest number of assigned conversations. The table displays the top 10 teammates against the number of assigned conversations.
- Closed Conversation Leaderboard (Top 10): It is a leaderboard of your teammates with the highest number of closed conversations. The table displays the top 10 teammates against the number of closed conversations.
4. Broadcast report
This report provides detailed information about your message broadcasts in terms of broadcast status, sent messages, delivered messages, read messages, failed messages, and queued messages.
Note: If you would like to access a detailed report of the broadcast campaigns, you can download the report by navigating to "Logs" and then, clicking on "Broadcast". In the listed broadcast campaigns, you can generate and download real-time broadcast reports.
Filtering and analysing data
Pepper Cloud message dashboard offers global filters that apply to the entire dashboard. You can filter the reports based on specific criteria such as:
- Date Range: Analyse data over specific periods to identify trends and track progress.
- Channels: Focus your analysis on specific communication channels for deeper insights.
- Users: Assess individual performance and identify areas for coaching or improvement.
Leveraging the message dashboard:
Now, you know everything about the messages dashboard. By regularly reviewing the message dashboard and analysing the data it provides, you can gain valuable insights into your communication performance and make informed decisions to improve your customer service.
Here are some ways you can leverage the message dashboard for your business growth:
- Identifying communication trends: Analyse conversation volumes and conversion rates to understand which channels are most effective for your audience and identify areas for improvement.
- Monitoring team performance: Track individual and team response times and resolution rates to identify high performers and areas for training.
- Optimising team structure: Analyse conversation assignments and identify opportunities to optimise your team structure for improved efficiency.
- Making data-driven decisions: Use the data provided by the dashboard to make informed decisions about your communication channels, staffing levels, and training programs.
By utilising the Pepper Cloud message dashboard effectively, you can gain a comprehensive understanding of your communication performance and unlock new possibilities for improving customer service and achieving your business goals. If you would like to know more about how to use the message dashboard for your business, talk to our customer support team.
