


Sales metrics: A master guide
Learn everything about sales metrics. Discover its importance and the crucial sales metrics that you should track for your business’s success.
“Numbers don't lie”
It is one of the famous adages which we all agree with. But the wrong or delayed numbers will certainly sound the death knell of any business.
“If you don’t have the command centre to prepare and analyse and can’t access the related metrics in real-time, you are dead.”, explains the business luminary and the SharkTank entrepreneur, Daymond John, in his blog.
Are sales metrics so important? If yes, which sales KPIs and metrics should be measured for your business? Let’s take a deeper look.
In this article, we will talk about:
- What are sales KPIs and metrics?
- Why is KPI for sales important?
- Do’s and Don’ts of KPIs
- Types of sales KPIs
What are Sales KPIs or metrics?
Peter Drucker once said, “If you cannot measure it, you cannot manage it.”
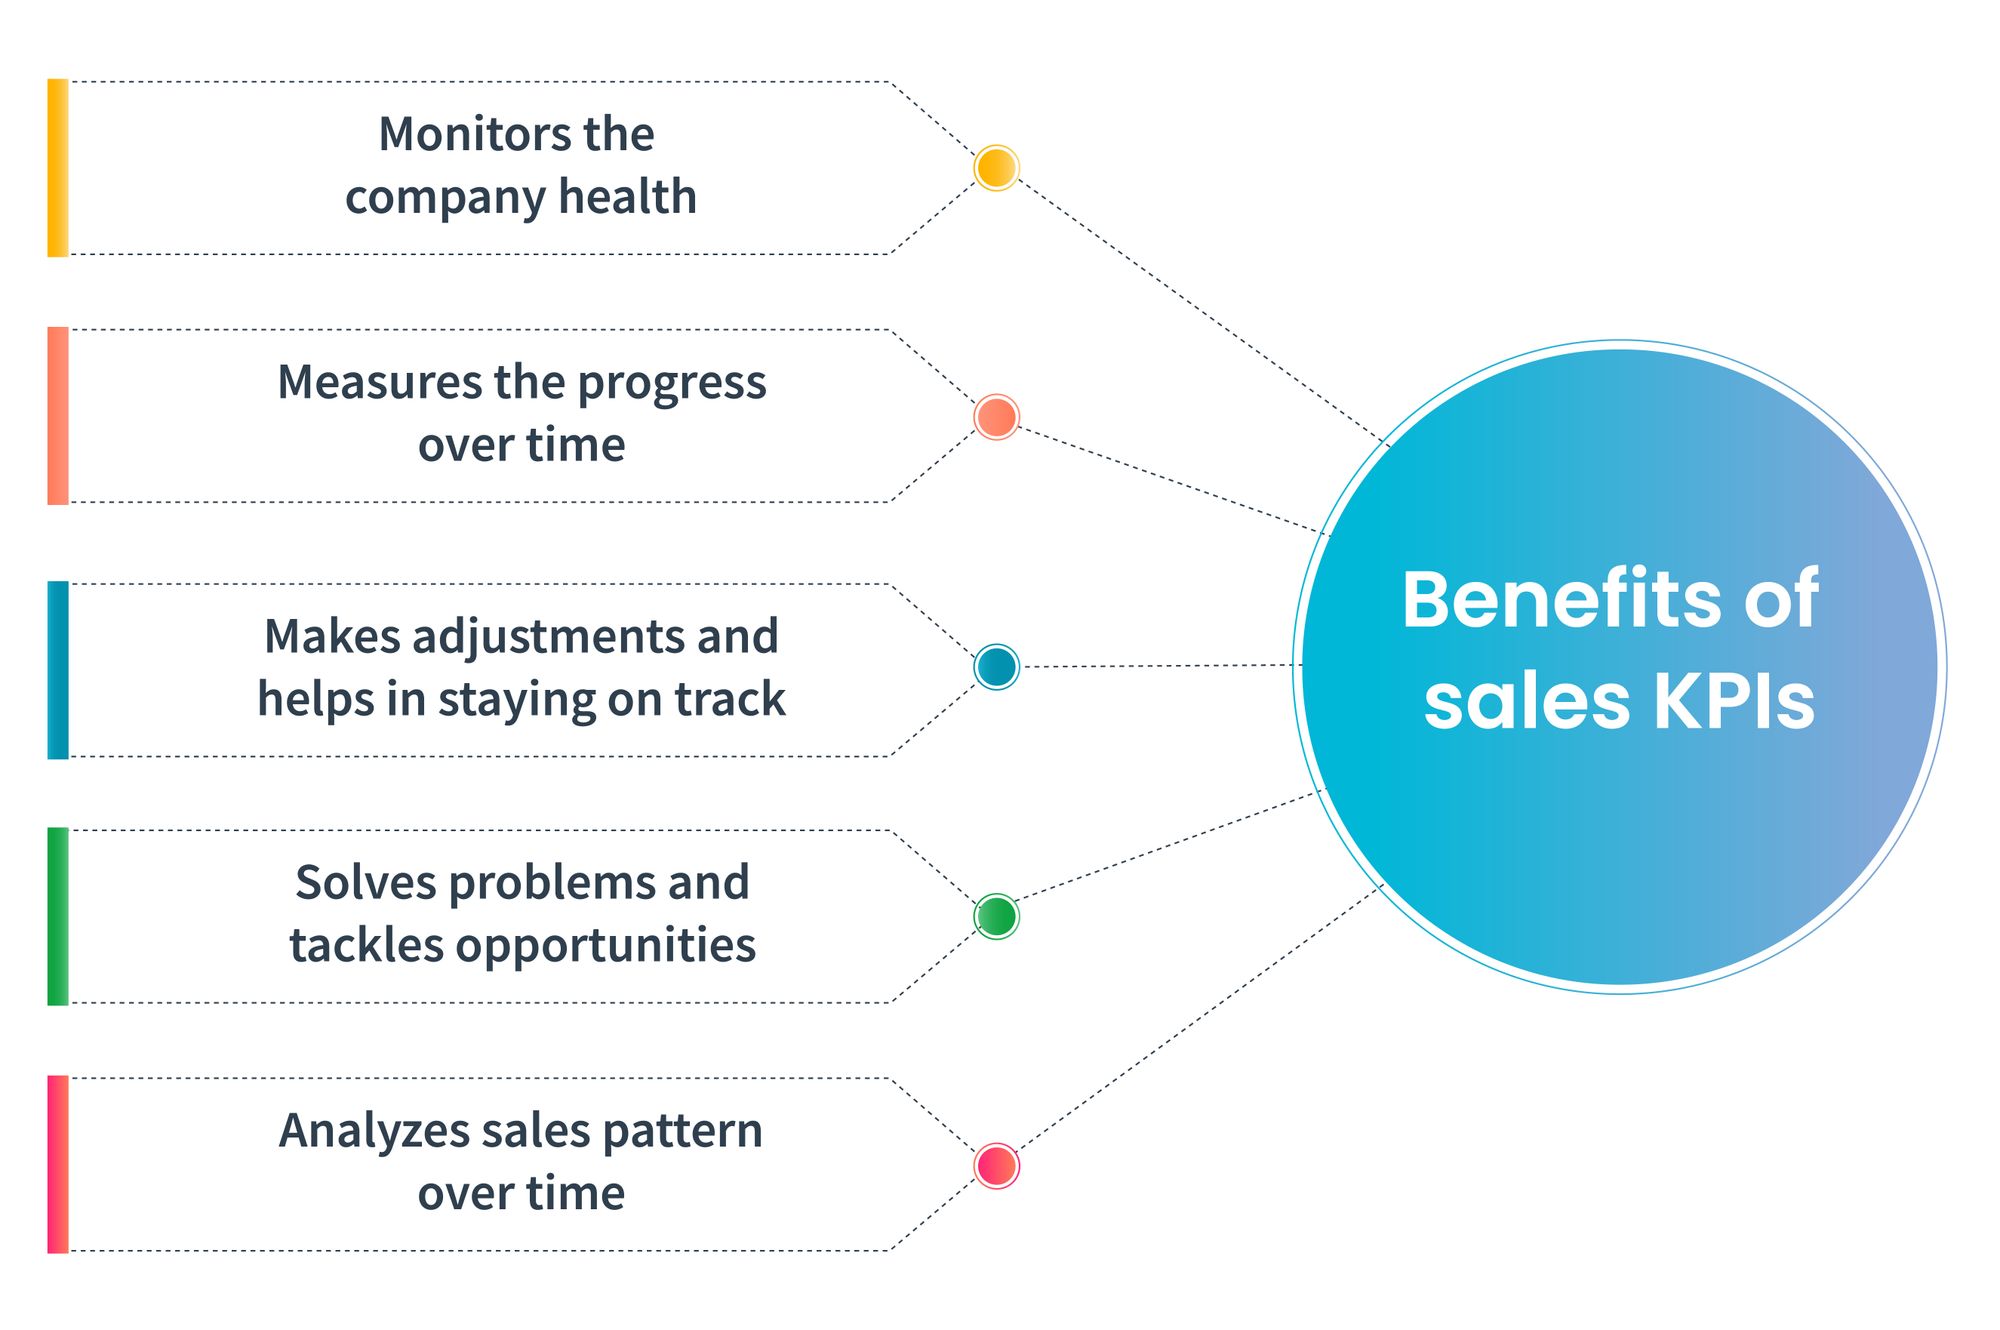
Key Performance Indicators (or KPIs) are the quantifiable metrics or signposts that assist in gauging the performance of the individuals, teams, or the organisation. The right set of KPIs can guide you in the right direction. But, devising the right set of KPIs for a business is a form of art.
To help you out, we have listed the Do’s and Don’ts of KPIs.
Do’s and Don’ts of KPIs
Do’s:
1. Plan your strategy:
Design the sales strategy that aligns with your sales objectives. Start this with a small set of strategic objectives. But, keep in mind the bigger picture and consider the long-term goals.
Some of the sales strategy examples could be:
- Eliminating the competitor
- Increase the number of loyal customers
- Expanding the business in a new territory.
Sales KPIs act as data points to these strategies and help measure the success of your sales strategies.
2. Define the questions:
KPIs are supposed to be meaningful and relevant. It is possible when they are aligned with your sales strategy goals and answer your key performance questions (KPQs).
For example:
If the strategic objective is: Growing the customer loyalty
KPQ can be: To what extent would your customer recommend your product
KPI can be: Net Promoter Score
3. Customise the KPIs
There may be a few common KPIs across the companies. Some of them are sales revenue growth, cash flow, etc. But, there is no one-size-fits-all in business strategies. Every company requires a unique set of KPIs to measure their strategic priorities.
For example, one company might be interested in Customer Lifetime Value(CLV) whereas the other might be interested in Net Promoter Score (NPS). Based on the unique needs of your company, you may create an index combining the KPIs.
4. Make your KPIs understandable
The sales objectives, sales strategy are bound to succeed only when everyone in the organisation understands the reasons behind measuring the performance and thereby accept the ownership of the KPIs. Hence, for every KPI you introduce, explain the rationale behind the KPI, help your team understand how it answers the KPQ, and how it links with strategic priorities.
Allow your team to provide feedback on the KPIs. This will help them to buy in and own them.
5. Analyse KPIs and use them to progress
The whole purpose of devising KPIs for your business is to assist in improving your performance. Hence, from time to time, you need to analyse, check its relevance to your business scenario, and understand if you are on track. Otherwise, it might just add the workload onto your team and make it harder to gain relevant insights.
Don’ts
1. Don’t be a copycat
One of the biggest mistakes most companies make is to measure the KPIs that another company seems to measure. A common example of this is when companies copy the customer feedback questions from others.
2. Don’t always opt for easy analysis
Albert Einstein once said, “Not everything that can be counted, counts. Not everything that counts, can be counted”
We often lean towards the easy to collect or count metrics. Hence, most of the time, we default to the metrics that we already have in our system. This leads to meaningless and mediocre sales KPIs and metrics.
In reality, the best sales KPIs require an investment of thoughts and often significant efforts in collecting and analysing the data.
3. Don’t let your KPIs go outdated
Your business evolves with time. Similarly, your KPIs should evolve too. The KPIs that never get updated will not necessarily capture the tactical or strategical changes and hence, become obsolete.
For example, if you are targeting to expand your business overseas then to match this sales objective, you must update your sales metrics and use metrics such as relative market share.
4. Don’t associate the KPIs with the incentives
Sales KPIs and metrics should improve the performance of your team. If KPIs are hardwired with the incentives, there is a higher likelihood of missing the wood for the trees. Although the ultimate KPIs can be associated with the incentives, the entire set of KPIs is better off left alone. Because KPIs are the information and insight tools and not the targets to be achieved.
5. Don’t use KPIs as targets
If KPIs are used to micro-manage your team and assess them individually, the KPIs lose their meaning as performance improvement tools. Instead, they act as performance targets. In such cases, KPIs become the tools to judge your team rather than the neutral indicator of the performance.
Types of Sales Metrics
Everything in sales is measurable. But, the challenge is in determining which sales KPIs and metrics you should focus on.
To help you figure it out, we have compiled a list of sales metrics. Read on!
Net Promoter Score (NPS)
“If you build a great experience, customers tell each other about that. Word of mouth is highly influential.” - Jeff Bezos
NPS score reflects on whether your customers would recommend your business to others. It helps you interpret how satisfied your customers are and how likely they are to remain as your loyal customers.
Why is the net promoter score important?
Most of the customer surveys are complex and hard to interpret. The net promoter score (NPS) was created to devise a standard measure.
Developed by Fred Reichheld, Bain & Company and Satmetrix, NPS holds the company and its employees accountable for how they treat customers.
The simple question asked to the customers while determining NPS is: “How likely are you to recommend our company to your family and friends?”
NPS is based on the fundamental thought that every company’s customers can be divided into three groups: Promoters, Passives, and Detractors.
This allows the company to measure their performance through its customers’ eyes. And at the same time, it allows the company to understand the customers’ behaviour such as repeat purchase and referral patterns over time.
When NPS is combined with appropriate diagnostics and follow-up actions, gaining customer loyalty and profitability is easy.
How can you measure NPS?
NPS is collected using surveys. Surveys can be done in two ways:
- Top-down NPS: Set up an anonymous survey. Contact your existing customers. Request them to rate your products and your competitors’ products. This will help you have an overview of the comparison between you and your competitors.
- Transactional NPS: This is to measure a key customer touchpoint that offers feedback on the operational performance.
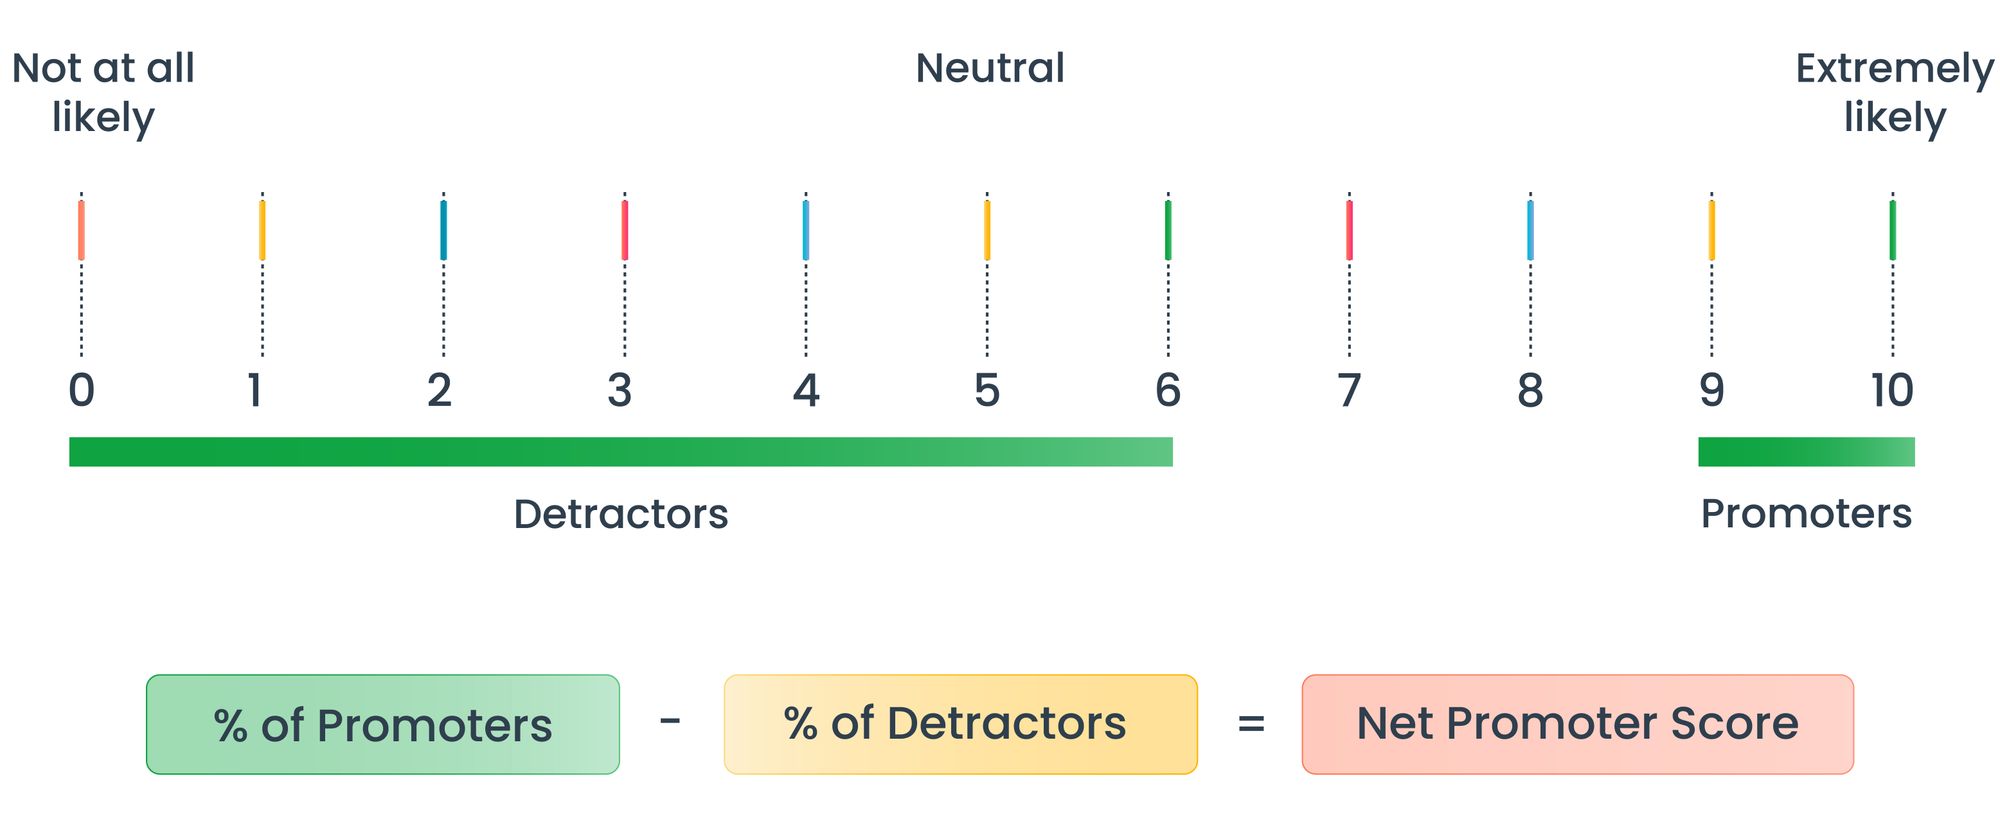
NPS calculator formula
Survey your customers and ask them to rate using a 0 to 10 scale.
- Promoters (score 9-10): Loyal enthusiasts who refer your business to others and promote your business growth.
- Passives (score 7-8): Satisfied but unenthusiastic customers. They are vulnerable to the competitors’ offerings.
- Detractors (score 0-6): Unhappy customers who can damage your brand and impede your business growth with bad word-of-mouth publicity.
Now, the obvious question would be what is a good net promoter score?
According to Bain & Co., the NPS score is defined as follows:
- Above zero: Good. It means your audience is more likely to be loyal.
- Above 20: Favourable score
- Above 50: Excellent score
- Above 80: Ultimate score
However, these are general guidelines. A good NPS score will always depend on the type of industry and the country.
According to Statista, the companies that are operating in the education and training sector achieve the highest NPS score (71) whereas the companies in the healthcare sector register lowest (27).
Customer Profitability Score
“I've learned that people will forget what you said, people will forget what you did, but people will never forget how you made them feel.” - Maya Angelou
But, often the companies go overboard to satisfy their customers and lose sight of the ultimate goal of the company - to make a profit.
Sounds confusing?
Allow us to explain.
Customers of the company contribute varying amounts to the company over their purchasing cycle. Simply put, while some customers contribute substantially to an organisation’s profit, others may cause loss to the company’s funds. To quote it with an example, the cost of delivering the product or service could be higher than the revenue generated from the transaction. This is where the Customer Profitability Score comes into play.
Customer profitability score helps you in prioritising the “right” set of customers rather than striving to delight all the customers regardless of their value to the organisation.
How to calculate customer profitability?
For customer profitability analysis, you can collect the data through the analysis of marketing and accounting data as well as output from activity-based costing exercises.
Customer profitability analysis formula
Customer profitability is the net profit made by an individual to an organisation, at any given point in time.

However, the customer profitability score covers several time-frames. It is not a single measure in itself. There are four measurements.
- The historical value of the customer: considers the value earned from a customer relationship over an extended period such as the fiscal year.
- The current value of the customer: considers a shorter time frame such as a month.
- Present value of the customer: This is a future-oriented measurement that considers the future revenue and cost streams of the customer’s existing business.
- Customer lifetime value: Considers the projected revenue and cost streams from the existing relationship and the expected business.
While customer profitability analysis seems like a very beneficial process, it is accompanied by flaws too. The reasons for this are that companies often do not have the right resources to accurately calculate and the cost of resources is often blurry for each activity. Nevertheless, it can be useful to re-examine your business strategies and allocate the right resources to serve the right customers.
Customer Retention Rate
“Retention is the single most important thing in the growth” - Alex Schulz
Any company that would like to grow should keep a close eye on customer retention.
Why?
There is a simple economic reason - nurturing an existing customer relationship is a lot cheaper than trying to win new ones. This is exactly why businesses aim to convert their first-time buyers into long-term profitable customers through reselling, cross-selling, and up-selling.
Simply put, the customer retention rates is a powerful indicator of current customer performance through real behaviours of the customers and it allows you to understand what percentage of your existing customers will be loyal to you and make a repeat purchase.
According to Fred Reichheld, “A 5% improvement in the customer retention rates will yield between a 20 to 100% increase in profits across a wide range of industries”.
How to measure customer retention rate?
If your business has accurate customer data handy, you can derive customer retention rates through the purchasing information of your customers. If you don’t have any customer data available, you can survey to estimate the customer retention rate.
Formula:
Customer retention rate measures the customers a company can retain over a specific period.
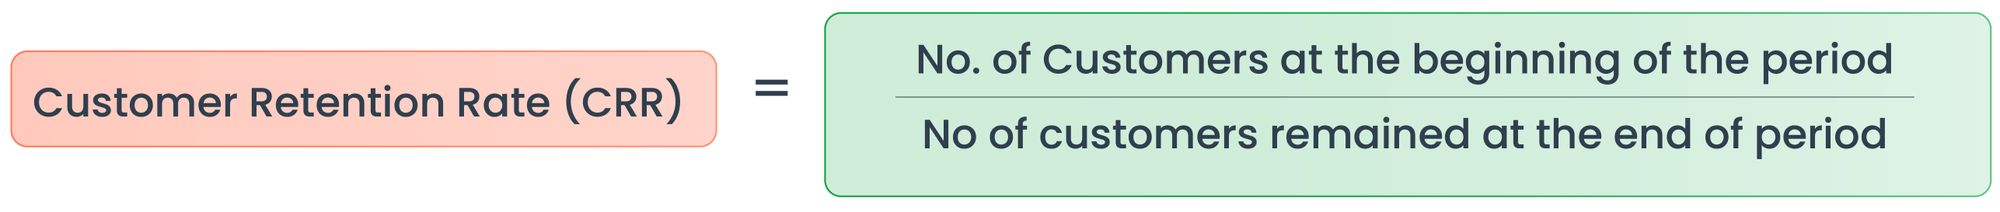
A better measure of customer retention rate KPI is to divide the number of customers at the beginning of a period who are at risk of leaving by the number of those customers who remained by the end of the same period.
Customer retention rates often vary widely between the industries. While the retention rate in retail banking is fairly high, it is generally low in the mobile phone or internet service provider sector.
Customer Conversion Rate
“It is much easier to double your business by doubling your conversion rate than by doubling your traffic” - Jefferey Eisenberg
Customer conversion rate is a holy grail of your business growth.
The customer conversion rate (also known as sales conversion rate or lead conversion rate) metric measures the effectiveness of your team in converting the leads into customers. The metric critically evaluates the performance of your sales funnel. But what constitutes a conversion rate can depend a little on your sales objectives.
For example,
- In a shop, the conversion would mean a visitor purchasing a good.
- In an e-commerce website, the conversion could constitute ordering a product.
- On your company website, the conversion could constitute the visitor calling you.
Understanding this sales KPI offers you an insight into the alignment of the sales and marketing team with your sales strategies.
As mentioned above, there are different types of conversion rates.
- Visitor sales conversion rates
- Lead generation conversion rates
- Click-through rates
- Tender or quote conversion rates
How to measure customer conversion rate?
The data collection method for customer conversion rate often depends on whether the conversion rate is being considered for physical shops or online websites.
While online websites allow you to track the conversion rates through web analytics, the retailers in the physical world often use simple counting mechanisms to count the number of customers walked into the store and the number of sales transactions.
Formula
In a simple form, the conversion rate is calculated with the following formula.
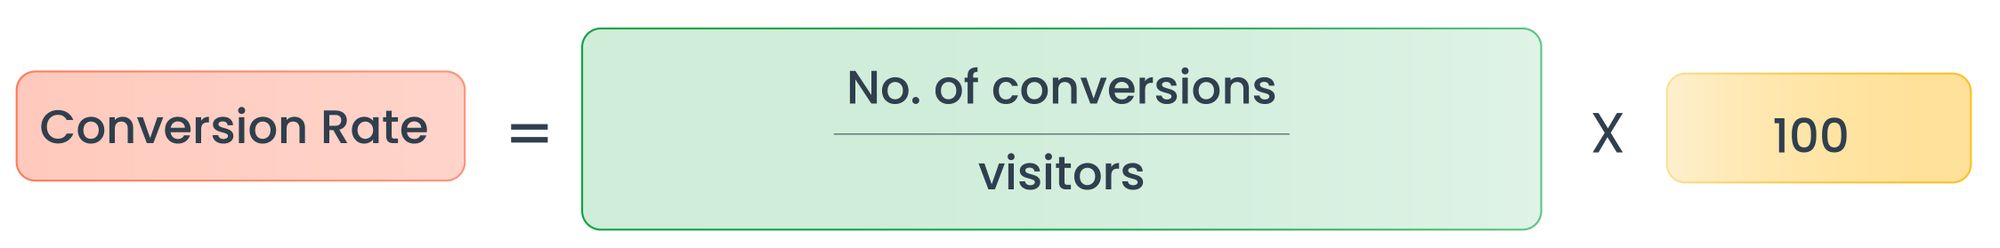
The number of conversions can be broken down into different steps of the conversion funnel.
For example, conversion from website visits to purchasing the product/service can be broken down into multiple steps.
- Website visit to contacting your organisation
- Contacting your team to trying out your product/service
- Trying out product/service to purchasing the product
The customer conversion rate is not as straightforward as it appears. Its high flexibility should always be supported by a clear definition of conversions associated with your business.
According to Firstpage, the average customer conversion rate in 2020 is lowest in the computer product manufacturing industry with just a 1.1% conversion rate whereas it is highest in the legal services industry with a 7.4% of conversion rate.
Relative Market Share
“Market share is king. You can’t afford to replace the lost one.” - Frank Perdue
Market share is a sales metric that helps companies to identify their position in the market compared to their competitor. In other words, it indexes the company’s market share against the leading competitor’s market share. This helps the businesses to identify the areas where they can improve and identify the sales and marketing activities that might be expected to be effective.
How to measure relative market share?
You can collect the data by analysing the annual reports that are available in the public domain. You can also conduct market research.
Formula:
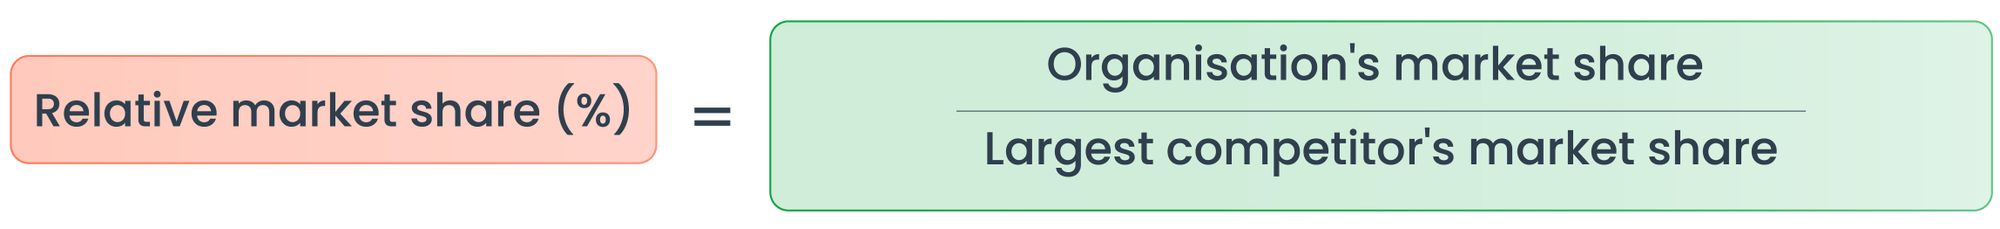
For example:
If your company’s market share is 30% and your largest competitor’s market share is 30% too. Then, the relative market share of your company will be 1. However, if your competitor’s market share is 60% and your company’s market share is 30%, the market share rate would be 1:2 implying your company is in a weaker position. If your competitor’s market share is 15% and your company’s market share is 30%, the market share rate would be 2:1. This implies your company is in a stronger position.
Market Penetration
“Don’t buy market share. Figure out how to earn it.” - Philip Kotler
And you can earn your market share by increasing your market penetration.
Market penetration is a measure of how much a product is purchased or used by the customers compared to the total estimated market for that particular product. This sales KPI helps in understanding the potential market size and also develops a suitable sales strategy.
How to calculate the market penetration?
Use the following formula to understand how much your product or service is being used by your customers in comparison with the total estimated market.

When to calculate the market penetration for your products or services?
Ideally, market penetrations should be calculated after every marketing and sales campaign. This highlights any changes in the penetrations and assists you in understanding the success rates of your campaign.
Customer Lifetime Value
“Acquisition of the customers might be on the verge of being mapped. The battlefield is going to be the retention and lifetime value.” - Gary Vaynerchuk
Of course, businesses must identify and nurture the most valuable customers who interact with your company and are loyal to them.
According to an article published by Harvard Business Review, gaining a customer can cost anywhere between five and 25 times more than retaining an existing one.
But how to identify the customers who contribute most to your business? With the help of customer lifetime value (CLV)!
Customer Lifetime Value (CLV or CLTV) is a metric that measures the total revenue that can be reasonably expected from a single customer throughout the business relationship.
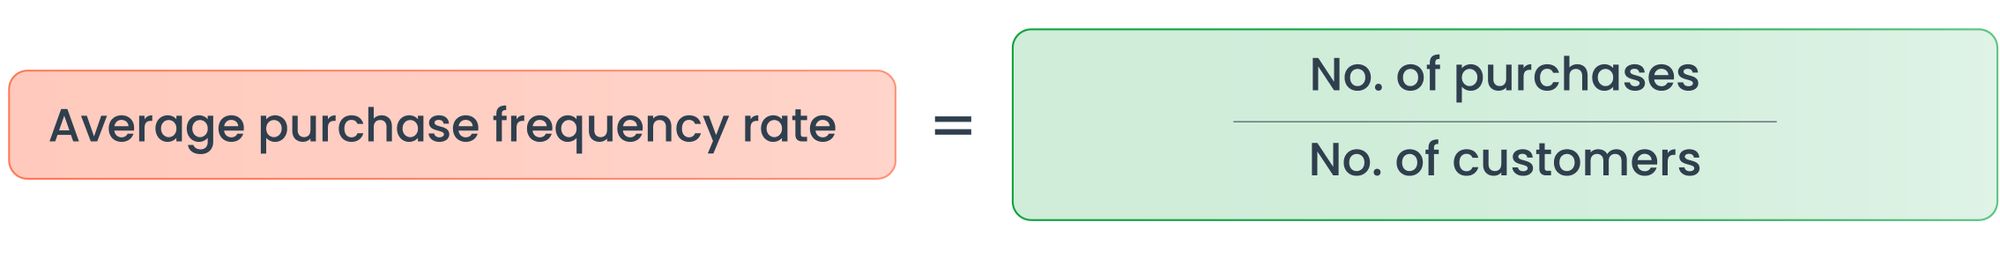
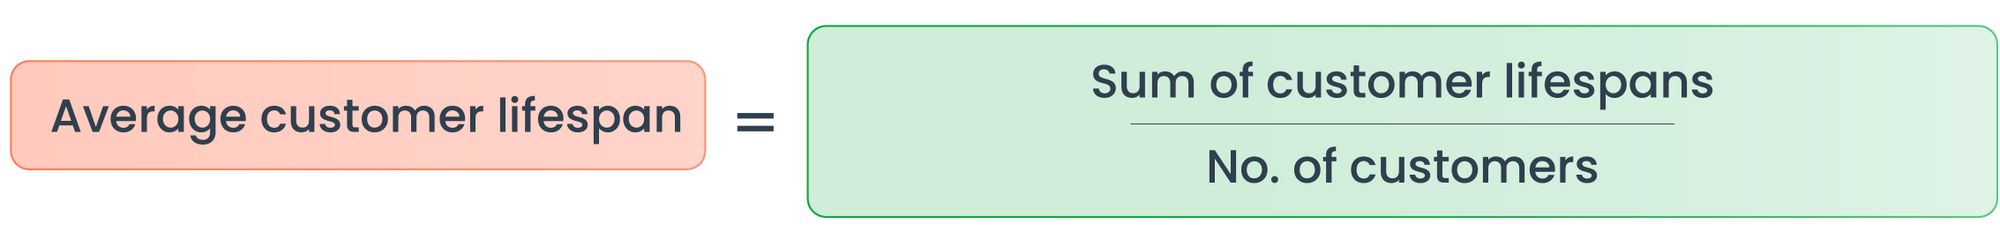
How to calculate customer lifetime value?
To calculate the customer lifetime value, we use number determinants such as average purchase value, average purchase frequency rate, etc. Here is the formula list.


You can improve CLTV by implementing various sales strategies such as optimising your onboarding process of the customers, incentivising the loyal customers, effectively engaging with your customers through social listening, regular check-ins, etc.
Activity Sales Metrics
“Concentrate on activities of prospecting, presenting, and following-up; the sales will take care of themselves” - Brian Tracy
Activities that your sales team performs daily can directly influence your sales. Those activities can be measured by activity sales metrics.
Some of the activity metrics are as follows:
- Calls made
- Emails sent
- Conversations
- Social media interactions
- Scheduled meetings
- Demos or sales presentations
- Referral requests
- Proposals sent
Activity sales metrics can reveal the strengths and weaknesses of your team while analysing the outcome of the activities.
Outreach Sales Metrics - Emails
“Email has an ability that many channels don’t: creating valuable, personal touches - at a scale” - David Newman
Email marketing campaigns can be super-effective when done smartly. In fact, Content Marketing Institute quotes that the email newsletter is the best way to nurture leads. In contrast, in another report, it is stated that 59% of marketers say email is their biggest source of ROI.
From lead generation to closing the deals successfully, it can play a major role. But the trick lies in reflecting upon the email campaign performances through email sales metrics. Some of the email sales metrics are:
- Open rate
- Response rate
- Engagement rate
- Subscribe/Unsubscribe rate
Conversion Rate Metrics
The available sales data of your company can be enormous but finding the right metrics to measure it can give you accurate measurements of your business growth. Here are a few conversion rate metrics that help you measure the opportunities.
- Percentage of closed/won opportunities
- Percentage of opportunities lost
- Percentage of opportunities lost to the competitor
- Percentage of opportunities won by lead source
- The average number of conversations for won opportunities
- The average number of conversations for lost opportunities
Pipeline Sales Metrics
“If you can predict the rate at which you create (or create and grow) qualified pipeline, and you know your average close rate(s), then you can start predicting your revenue.” - Aaron Ross, CEO, Predictable Revenue Inc.
The value of gauging the health of your sales pipeline and tracking your sales cannot be overstated. Hence, to keep a tab on these, pipeline sales metrics help. Some of the pipeline sales metrics are:
- The average length of the sales cycle
- Total open or closed opportunities
- Probability weighted value of the pipeline
- Win rate
- Conversion rate by sales funnels stage.
Read our blog to know more about the sales pipeline and how it can benefit your business.
Miscellaneous Sales Metrics
There are many more sales metrics that you can use to measure your sales team performance. We have prepared a list for you.
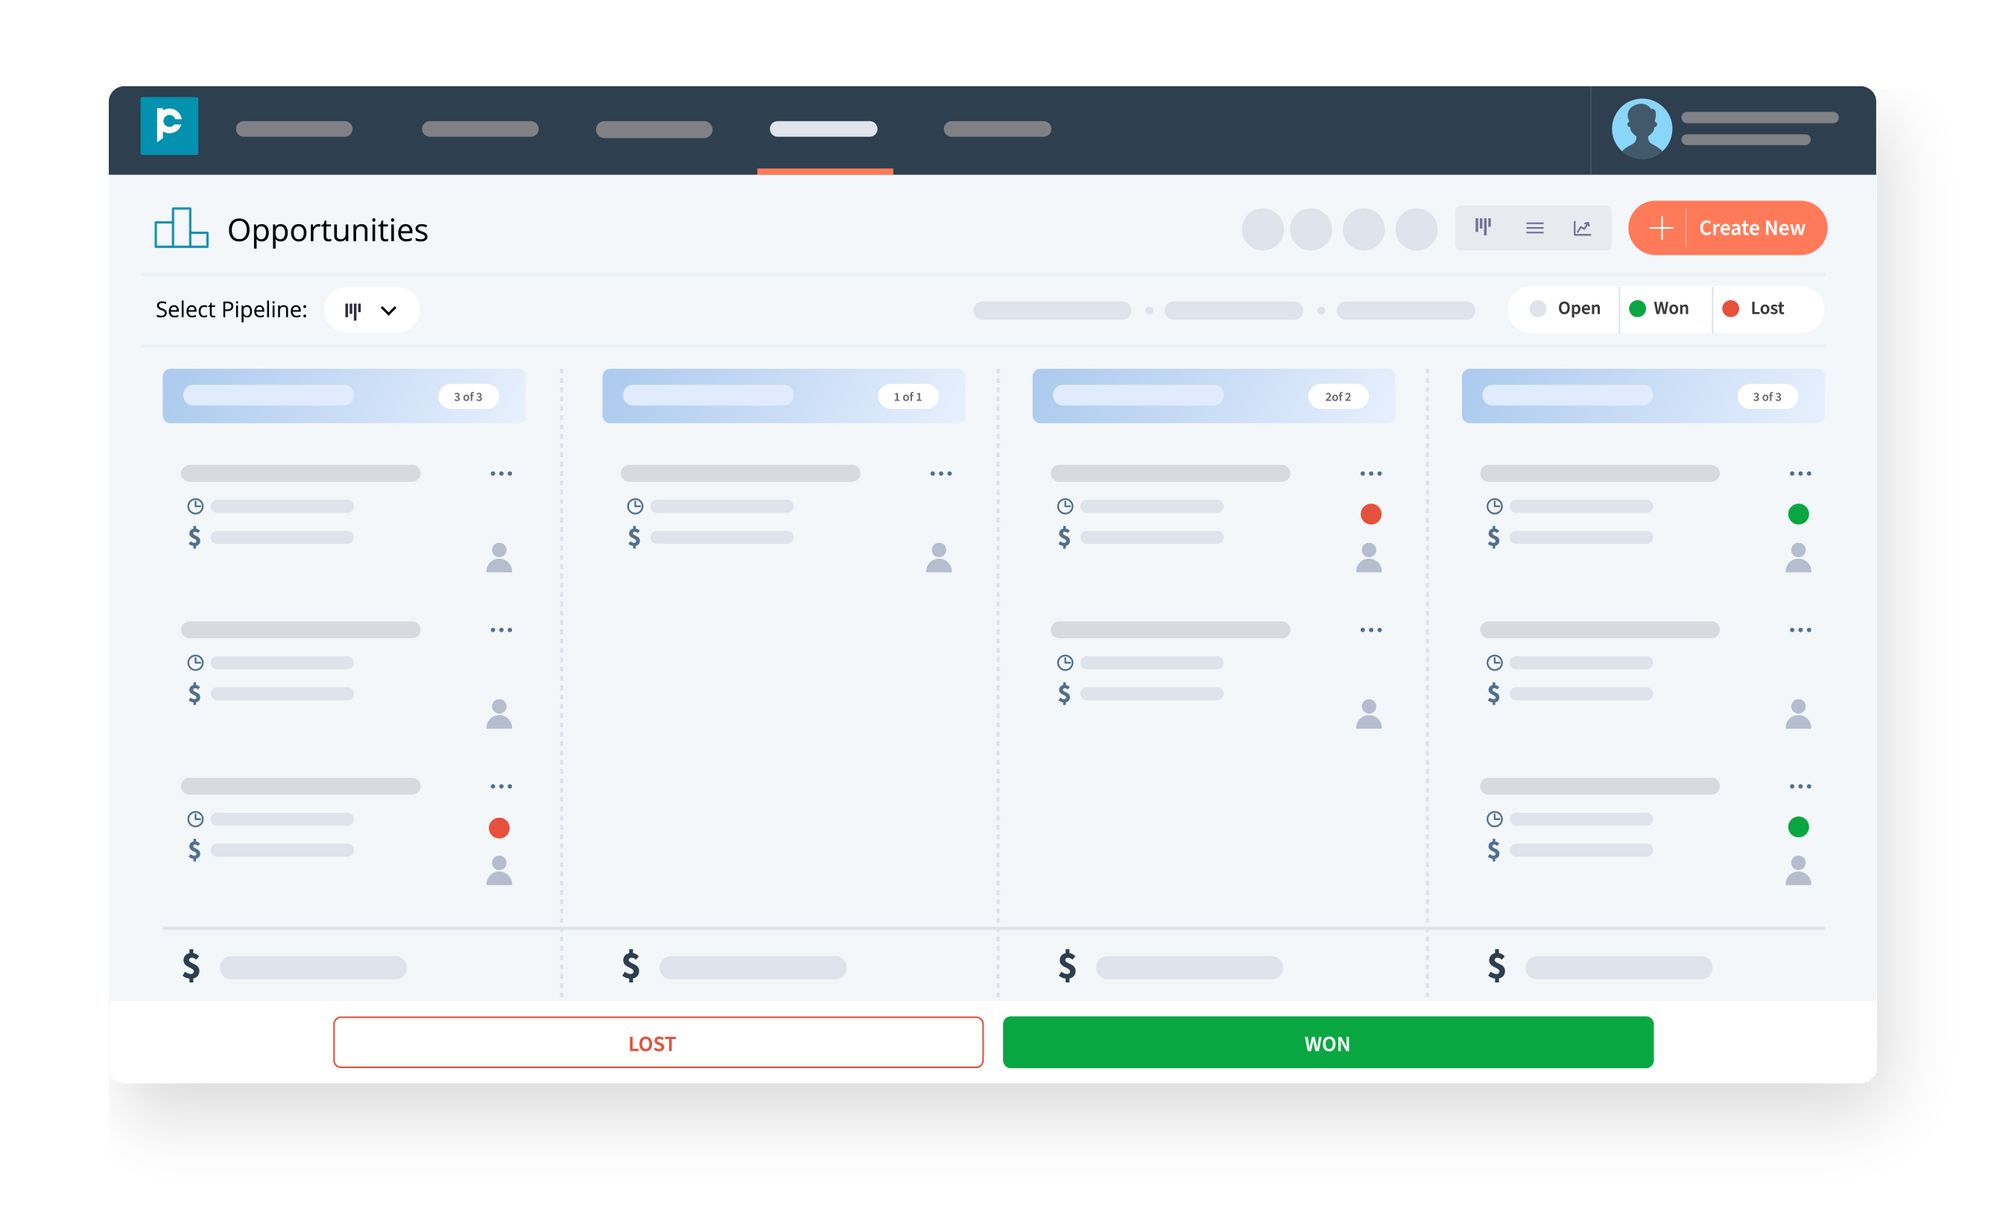
Sales Dashboard
As mentioned above, sales metrics can infer the insight related to the effectiveness of your sales strategies, the performance of your sales team, and assist you in making critical business decisions. These can be viewed in a visual format through the sales dashboard.
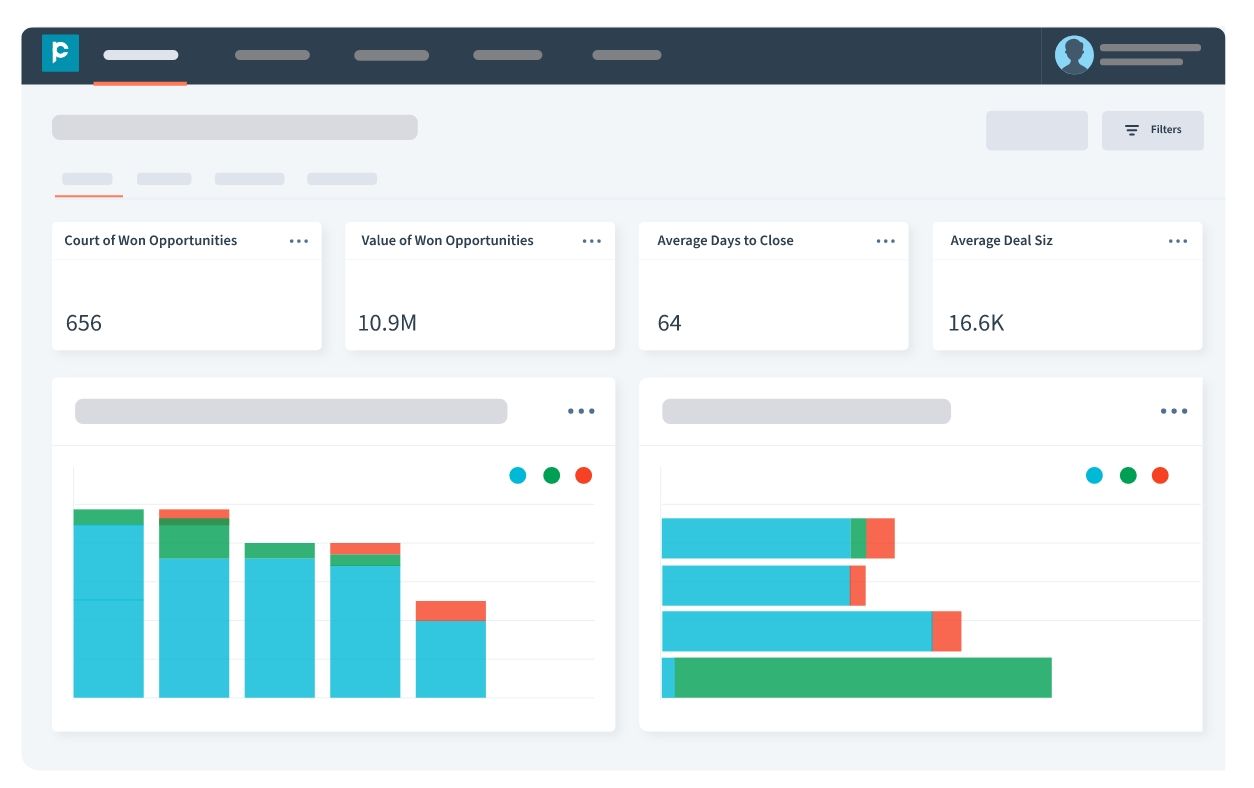
Pepper Cloud CRM offers you a sales dashboard so you can access the visuals of your sales metrics and the performance of your sales team.
The sales dashboard lets you track:
- Count of Won Opportunities
- Value of Won Opportunities
- Average Days to Close
- Average Deal Size
- Sales Leaderboard
- Sales Funnel
- Won Opportunities by Source
- Lost Opportunities by Reason
- And many more
In nutshell, for a company to grow, you need to keep an eye on your competitors, track your performance, watch out for your sales objectives and align them with your sales. But the real trick lies in measuring your sales objectives and sales strategies through the right set of sales KPIs and metrics.
Do you want to know how sales metrics can assist you in flourishing your business? Talk to us!
Further reading
- An ultimate guide to sales pipeline
- An expert’s guide to inbound and outbound sales
- Sales activities: Building blocks of sales process
- Access controls for sales organisations - A complete guide
- How to forecast sales: Methods and best practices
- Accelerating B2B sales cycle with instant messaging
